


CAGR Analysis: Why Dick Around With Banks?

Winners Win
What the hell is a CAGR analysis, you ask? CAGR stands for Compound Annual Growth Rate. Essentially, in investing parlance for the purpose here, CAGR is the annual compound return of an investment over a given period. Have you ever heard of the S+P 500 index compounding at something like 10% average over a long period if you include a dividend yield of about 2%. Those are rough numbers but you get the idea. CAGR Analysis is the final in my series of Value Stock Investing Posts that will lead for being able to do a 5 minute stock analysis for any stock. Here are the other posts in case you missed them.
FREE STOCK VALUATION TOOL… and how to best use it!
Value Stock Education – Part 1 – Why?
Best Free Tools for Stock Analysis
What can a CAGR analysis tell us?
When I first started this analysis it was part of my dive into what drove stock returns. Since I started to get my stock investing head screwed on straight back in 2016 I have avoided certain industries and their stocks. I hate banks, energy companies, mining companies, and maritime shipping companies in general. But, what if I was wrong? What if I looked at the very best in those industries? Well, I did just that. I started by making a cool Google Sheet that updates in real time. It looks like this:
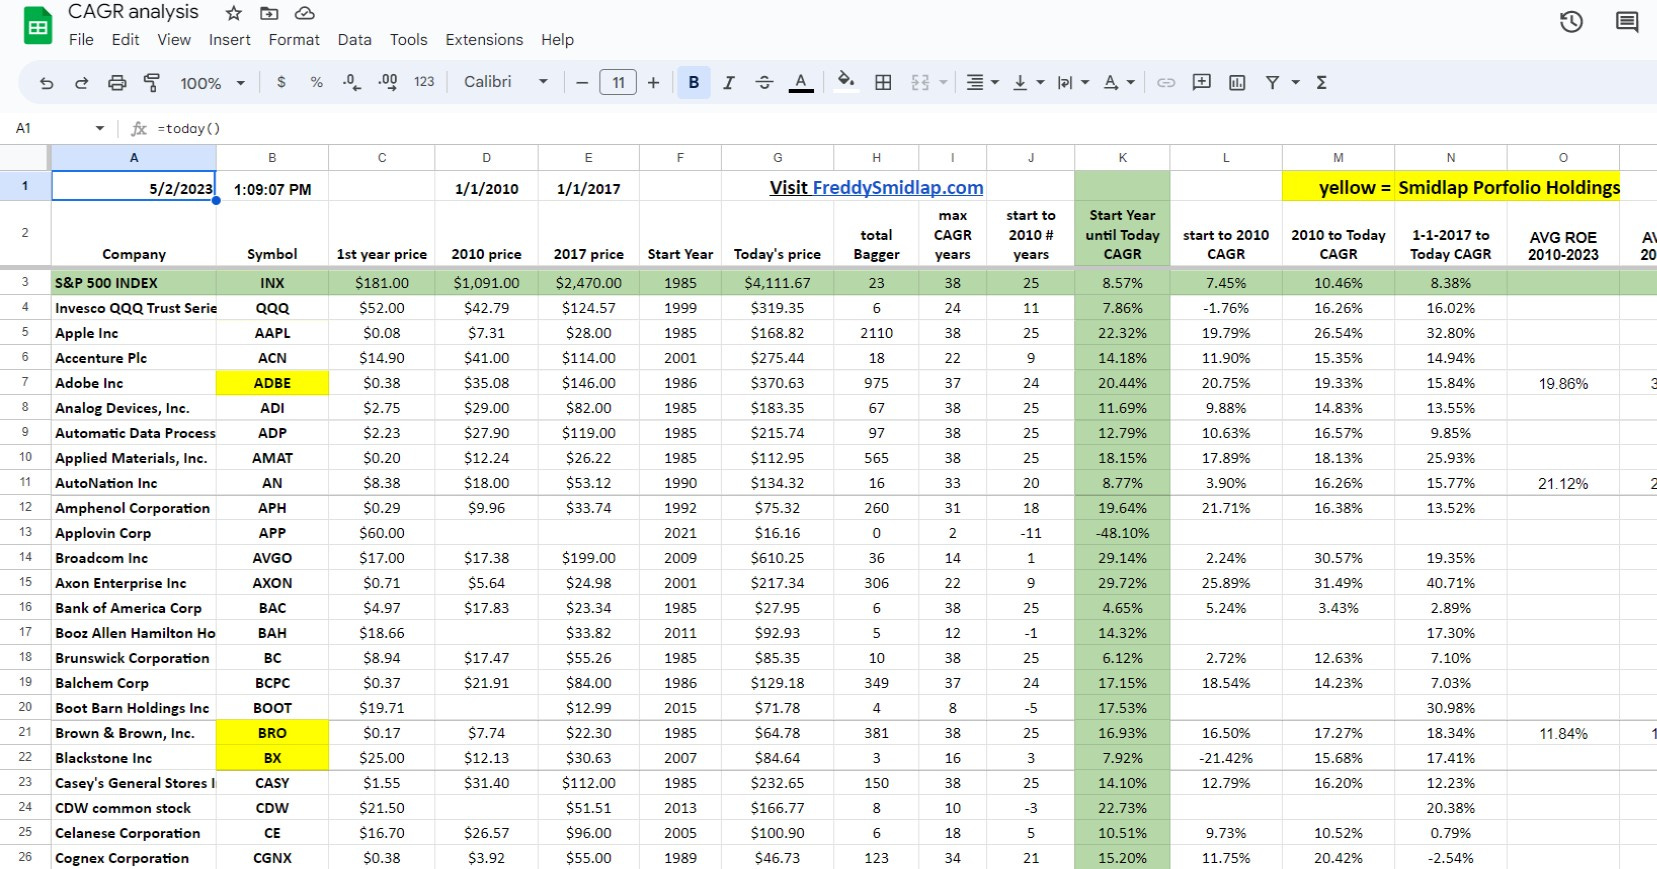
It contains over 170 different stocks analyzed over a long period of time and updates in (almost) real time. Here is a link to the sheet in case you want to have a viewing or input some of your own stocks: CAGR Analysis Google Sheet.
You know the old saying about past performance not being a guarantee of future results? I would say yes and know to that notion. Companies compounding at a high rate consistently for years are often the best in their industry or niche and many of them can keep going so long as they are not totally disrupted by changing laws of technology.
Methodology
I looked back at some of the best and best-known companies all the way back to 1985 (if applicable) to find their CAGR's from their initial date until today. I also added data from the beginning of 2010 and beginning of 2017 to see if the success patterns for the stocks held or got better or worse over certain periods. Those data are all in the sheet. I did this without adding back dividend yields but you can still get a pretty good idea from the long term CAGR analyses of what kind of companies have dominated over a long period.
Here is one example of dividend darling Johnson and Johnson, long considered "blue chip" by many. JNJ Stock quote. JNJ's split adjusted stock prices are here:
$2.90 in 1985
$65.20 in 2010 - 13.3% CAGR from '85 to '10
$124.55 in 2017
$175.08 in 2023 - 7.5% from 2010 to 2023, and 5.3% from 2017 to 2023
Meanwhile the S+P 500 (with a 1.5 to 2% dividend yield) had the following CAGR's
1985 to 2010: 7.5%
2010 to 2023: 11.1%
2017 to 2023: 9.9%
Even with the average 2.5% dividend yield since 2010 JNJ investors would have lost to the S+P 500 index. The bloom is off the rose for that company of many other former stalwarts who did not adapt to changing times. I have always said if you cannot exceed returns of the index then you should just own the index and call it a day. Most people should probably just mostly own the index anyhow and get on with enjoying their lives. So, even though JNJ is up 60 times in value since 1985 compared to 25 times for the S+P 500 it's good to realize most of those gains came before 2010.
Forget owning it for the dividend yield alone because total return is all that matters. I did a similar analysis of popular (and crappy) telecom dividend companies like AT+T and Verizon in Dividends Are Overrated.
Let's now contrast the JNJ CAGR analysis with and insurance broker you've likely never heard of. Brown and Brown (BRO stock quote) is a Smidlap holding and competitor of Smidlap and Malevolent Missy holding Arthur J. Gallagher. They are in the insurance brokerage business and have both been wildly successful businesses and stocks. Here are the stats for BRO since 1985:
1985: $0.17 per share
2010: $7.74 - 16.5% CAGR from '85 to 2010
2017: $22.30
today 2023: $70.45 - 17.7% CAGR from '10 to '23 and 19.1% from '17 to '23
My advanced mathematical skillz and spreadsheet tell me that equals an incredible 414 times return on investment over 38 years! If you ever hear of BRO being mentioned by the talking heads on the business channel let me know because I doubt it will happen. They are not sexy to discuss and are still only a $20 billion market cap company even with all that growth. That 17.2% CAGR over a 38 year period really supercharges returns and they did it all in a steady and boring fashion. For my money if you can't expect to get at least 12-13% over a long holding period you should just own the index. The thing I like about companies like BRO and AJG is that you can just buy them and not worry much. If you are lucky enough to catch a little pullback (BRO was $54 earlier this year, 32% off today's price) all the better.
Banks Suck!
They sure don't suck at overpaying their high priced talent and taking clients' money, especially the large banks. Investment banking bro's make a fortune but does that money come back to the shareholders? Well, the results are "not overwhelming." Let's look at the cases of three of the widely considered "best banks" by consensus and national attention: JP Morgan, Bank of America, and Goldman Sachs.
JPM has a lackluster 6.75% CAGR from 1985 to today. They were very mediocre from '85 to 2010 (near the end of the great financial crisis) at 3.4%. Since 2010 to today they earned a respectable 12.9% and 2017 to today netted a decent 8.5% CAGR. That's not terrible and you certainly would not have lost money (which is good) but I wanted to bust the illusion that these banks were outperformers. For the past 6.5 years even blue blood JP Morgan Chase is losing to the overall market.
How about old Bank of America? BAC got you a compounded return of around 5% for every period since 1985, excluding dividends. You haven't even gotten that great a dividend yield in that time either. 5% a year is pretty terrible for a long term holding but still better than losing money.
Goldman Sachs must be a great performer though, right? After all they pay their top personnel hundred of thousands of dollars a year and sometimes more! Those eggheads must be driving shareholder returns, right? Wrong! GS has consistently generated about 7.3% yearly consistent returns since 1985. That's pretty mediocre.
One way you could probably make money investing in banks if to buy them near crisis bottoms (there seems to be a new banking crisis every few years) and then sell them before they have time to flounder. But we prefer to buy and hold companies whenever we can. Why dick around with banks when you could just buy a nice insurance broker like Arthur J. Gallagher or Brown and Brown?
The one place banks are truly useful to consumers and investors is when they pay out free money in the form of account and credit card bonuses.
What do y'all think about banks as investments? Are you surprised by the difference in returns between the huge banks and the insurance brokers I mention? Check out the sheet for more fun surprises and under the radar companies like Fastenal who steadily keep outperforming. It's not all high end tech companies getting these fantastic returns.